

Impact That Lasts.
Transforming Lives Through College Completion:
Our Social Return on Investment, Explained
Behind these demographics lies the future of the U.S. workforce — talent too valuable to lose. These students represent the largest untapped pool of technologists in the country, standing at the threshold of graduation and careers that fuel innovation and competitiveness.
$2,162 delivered at the brink of dropout can return 45x its value to society, because the final barrier to graduation is often financial, not academic. Using real salary data from 3,558 graduates matched to national labor market outcomes, Last Mile finds a 45× social return over 10 years (6× in year one alone).
Small, timely capital at the finish line doesn’t just change a single outcome—it unlocks a decade of earnings, mobility, and workforce impact.
Just-In-Time Investment
It all starts with a strategic investment in a student's future. Each Last Mile award covers critical expenses that stand between striving students and their degrees.
Average Student Award:
$2,162
With Last Mile's support, students who might otherwise drop out can complete their degrees.
But how much more likely are they to succeed?
Breaking the Dropout Cycle
Our targeted support provides funding and creates a support system that dramatically increases graduation success rates.
Graduation Rate of Last Mile Students:
Average National Graduation Rate*:
*for four-year degree completions
80%
65%
Graduation is the turning point for lifetime earning potential. The income gap between those who complete their degree and those forced to stop short is nothing less than staggering.
Economic Reality: Degree vs. Dropout
A degree changes everything. The economic difference between completing a degree and dropping out is a completely different economic trajectory. Graduates earn nearly 4x what college dropouts earn, from the very first year.
Starting salary for a Last Mile graduate:
Average salary without a degree:
$85,516
$23,119
The Earnings Gap A Degree Creates
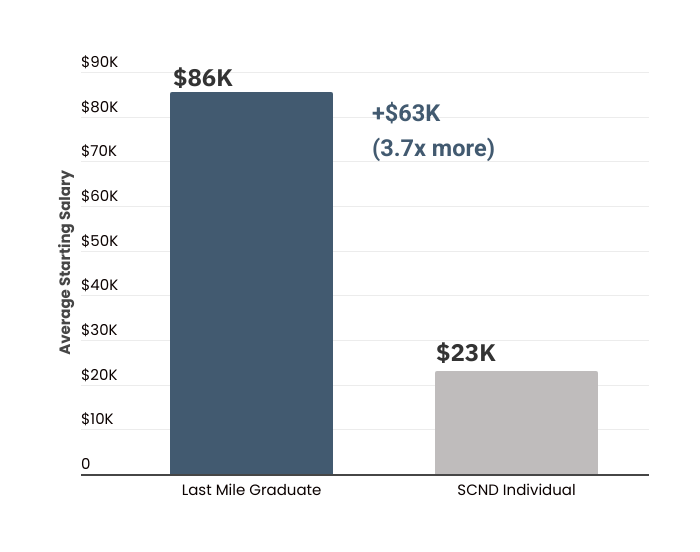
The core of Last Mile's impact comes from a well-documented but underappreciated labor market fact: in STEM fields, the difference between a degree and dropping out is not incremental — it's a cliff.
Last Mile graduates with a bachelor's or associate's degree in computer science or engineering earn roughly $86K at the start of their careers. Their counterparts who started college but never finished (some college, no degree, or SCND) earn around $23K. That's a $63K gap in the very first year, and it doesn’t stop after one year. This gap compounds across a lifetime, shaping every opportunity that follows.
Proof That Potential Outweighs Privilege
Our graduates aren't just earning more - they're landing positions at companies that validate their education and open doors to even greater opportunities.


The “Last Mile Effect” Over a Decade
But the real story isn't just year one. The gap compounds.
STEM graduates follow a steep upward earnings trajectory — the kind common to CS and engineering occupations, where experience commands rapidly rising salaries. SCND workers follow a much flatter national path. By year 10, the cumulative earnings difference exceeds $1.23M.
The Ten Year Salary Gap
That’s the lifetime economic impact unlocked when a $2,162 award carries a student to graduation. This is what makes Last Mile's model so powerful: a small award at the right moment prevents a very large, permanent economic loss. One investment, one degree — and the ripple strengthens entire communities.
The Return on Investment: 45×
Most social impact calculations are optimistic by design. Organizations often count 100% of outcomes as their own, use low discount rates that inflate present-value returns, and measure only the money that goes out the door as their cost. We do none of those things.
Last Mile's sROI calculation applies three layers of conservative discounting:
Causal attribution (31%): We only claim value for graduates who confirmed Last Mile's award was genuinely necessary for their graduation — surveyed directly and on a continuous 0–100 scale, not snapped to a binary yes/no. Two-thirds of the nominal return is discarded because those students would likely have graduated anyway.
Private market discount rates (8.6, 8.7, 9.2%): Most social programs use a "social time preference rate" of 3–3.5%, which is generous by design. We use rates derived from Treasury yields plus an equity risk premium — the same benchmark a private investor would apply. This is 2–3× more stringent than the sector norm.
Graduation rate adjustment (80%): We apply the actual observed graduation rate among award recipients, not the hoped-for one.
After all three adjustments, the 10-year weighted sROI is 45×. In year one alone, it's 6×.
Heavy discounting. Still extraordinary returns. We stress-test these numbers against private market benchmarks — and the ROI holds.
Building Stronger Communities
Higher incomes contribute significantly more in taxes, funding schools, infrastructure, and community services that benefit everyone.
Last Mile graduates shift from welfare recipients to net taxpayers — generating $478K in public value that effectively repays the grant hundreds of times over.The story isn't just about private income. It's about what happens to government accounts.
In year one, the typical SCND individual receives $17K in net government transfers — SNAP, Medicaid, housing assistance — while the typical Last Mile graduate contributes $9K in net taxes. That's a $26K swing in the government's favor, per person, per year, in year one alone.
Graduates Become Net Taxpayers. SCND Individuals Remain Net Recipients
Annual net fiscal impact (taxes paid minus transfers received) for Last Mile graduates vs. college dropouts. Last Mile Graduates are net contributors from year one; dropouts remain net recipients for years. Source: CBO 2022; IRS 2025; FICA 7.65%
Over a decade, the cumulative fiscal impact of each award reaches $478K — combining increased federal and state tax revenue with reduced transfer spending.
This means Last Mile's model effectively pays for itself not just once, but hundreds of times over, in avoided public costs alone.
To put it another way: if a government program returned $478K per $2,162 invested, we'd call it a policy triumph. Last Mile achieves it through private philanthropy.
When you weigh increased earnings, tax revenue, and community boost against investment per student, the return is undeniable.
An Unmatched Return on Investment
$887,393 in additional earnings
$2,162 average Last Mile award
= $45 social return for every $1 invested
Every $1 donated to Last Mile creates $45 in social and economic value by carrying a student to graduation, before even counting the broader community, innovation, and intergenerational impact.
Last Mile's approach — targeting students at the exact cliff edge of dropout, where a small award prevents a large permanent earnings loss — creates returns that far exceed both peer nonprofit programs and private market investment benchmarks.
Every $2,162 invested generates $478K in present-value social returns over 10 years. That's not a rounding error. That's a structural advantage created by intervening at precisely the right moment.
How We Calculated This
This analysis is grounded in real data from real people, not estimated averages.
We collected job titles from 3,558 actual Last Mile graduates — via LinkedIn and direct surveys — and converted them to Standard Occupational Classification codes using OccuCoder, a federally-recognized job-matching tool. We then benchmarked salaries for each role using the Census Bureau's American Community Survey (2024) and fine-tuned 90% of those estimates using Lightcast labor market data at the employer-role level.
The counterfactual — what graduates would have earned without the degree — is drawn from the Census Current Population Survey ASEC (2024), which provides earnings trajectories by education level and age band for millions of American workers.
Tax and transfer modeling uses 2025 IRS federal brackets, FICA rates, and CBO data on means-tested transfers by income quintile. The discount rate is constructed via CAPM: Treasury yield plus a 5% equity risk premium — a private-market standard far more demanding than the social discount rates typical in the field.
Data sources: ACS 2024, CPS ASEC 2024, Lightcast, OccuCoder (UI ITSC), IRS 2025, CBO 2022, U.S. Treasury March 2026
Back the nation’s most overlooked source of tech talent—by investing in them at the critical last mile, funders unlock exponential returns—for individuals, communities, and the national economy.
Invest Where Impact Is Proven
Book a Conversation
Speak with our fund development team to donate and about opportunities for partnership.
The return on investment is both extraordinary and immediate.